Previously, the requirements for the image quality of camera modules were primarily determined by the visual requirements of the consumer segment of photography (e.g. digital reflex cameras, smartphone cameras, and action and drone cameras). With more than 25 years of experience, TRIOPTICS has been the leading supplier of testing equipment used to qualify the image quality of optical lenses and objective lenses.
The increased application of camera systems for safety-related and automated object recognition and classification, for instance in the safety & surveillance business and in the automotive industry (keyword: autonomous driving and driver assistance systems), results in new and sometimes greater requirements for the characterization of the image quality of camera modules. The entire test chain for optical systems, sensor components and complete camera systems must meet these new requirements.
Here, TRIOPTICS relies on its many years of experience in optical testing and complements this by new measurement systems for opto-electric and opto-mechanical measurement parameters.
The automotive industry in particular requires a 100% testing technology that also achieves a high degree of reproducibility and accuracy in volume production with the shortest possible cycle times.
For this purpose, TRIOPTICS has developed test systems that make it possible to determine the most important measurement parameters in a reproducible fashion and with the shortest measurement time as an end-of-line (EOL) test integrated in fully automated production lines.
The following features can be tested:
- Optical characteristics, such as focusing, distortion, vignetting and image contrast (MTF).
- Opto-mechanical characteristics, such as the position of the image sensor in relation to the lens, optical center of distortion or roll angle.
- Opto-electric characteristics, such as defective pixels, image noise, linearity, color reproduction or relative illumination.

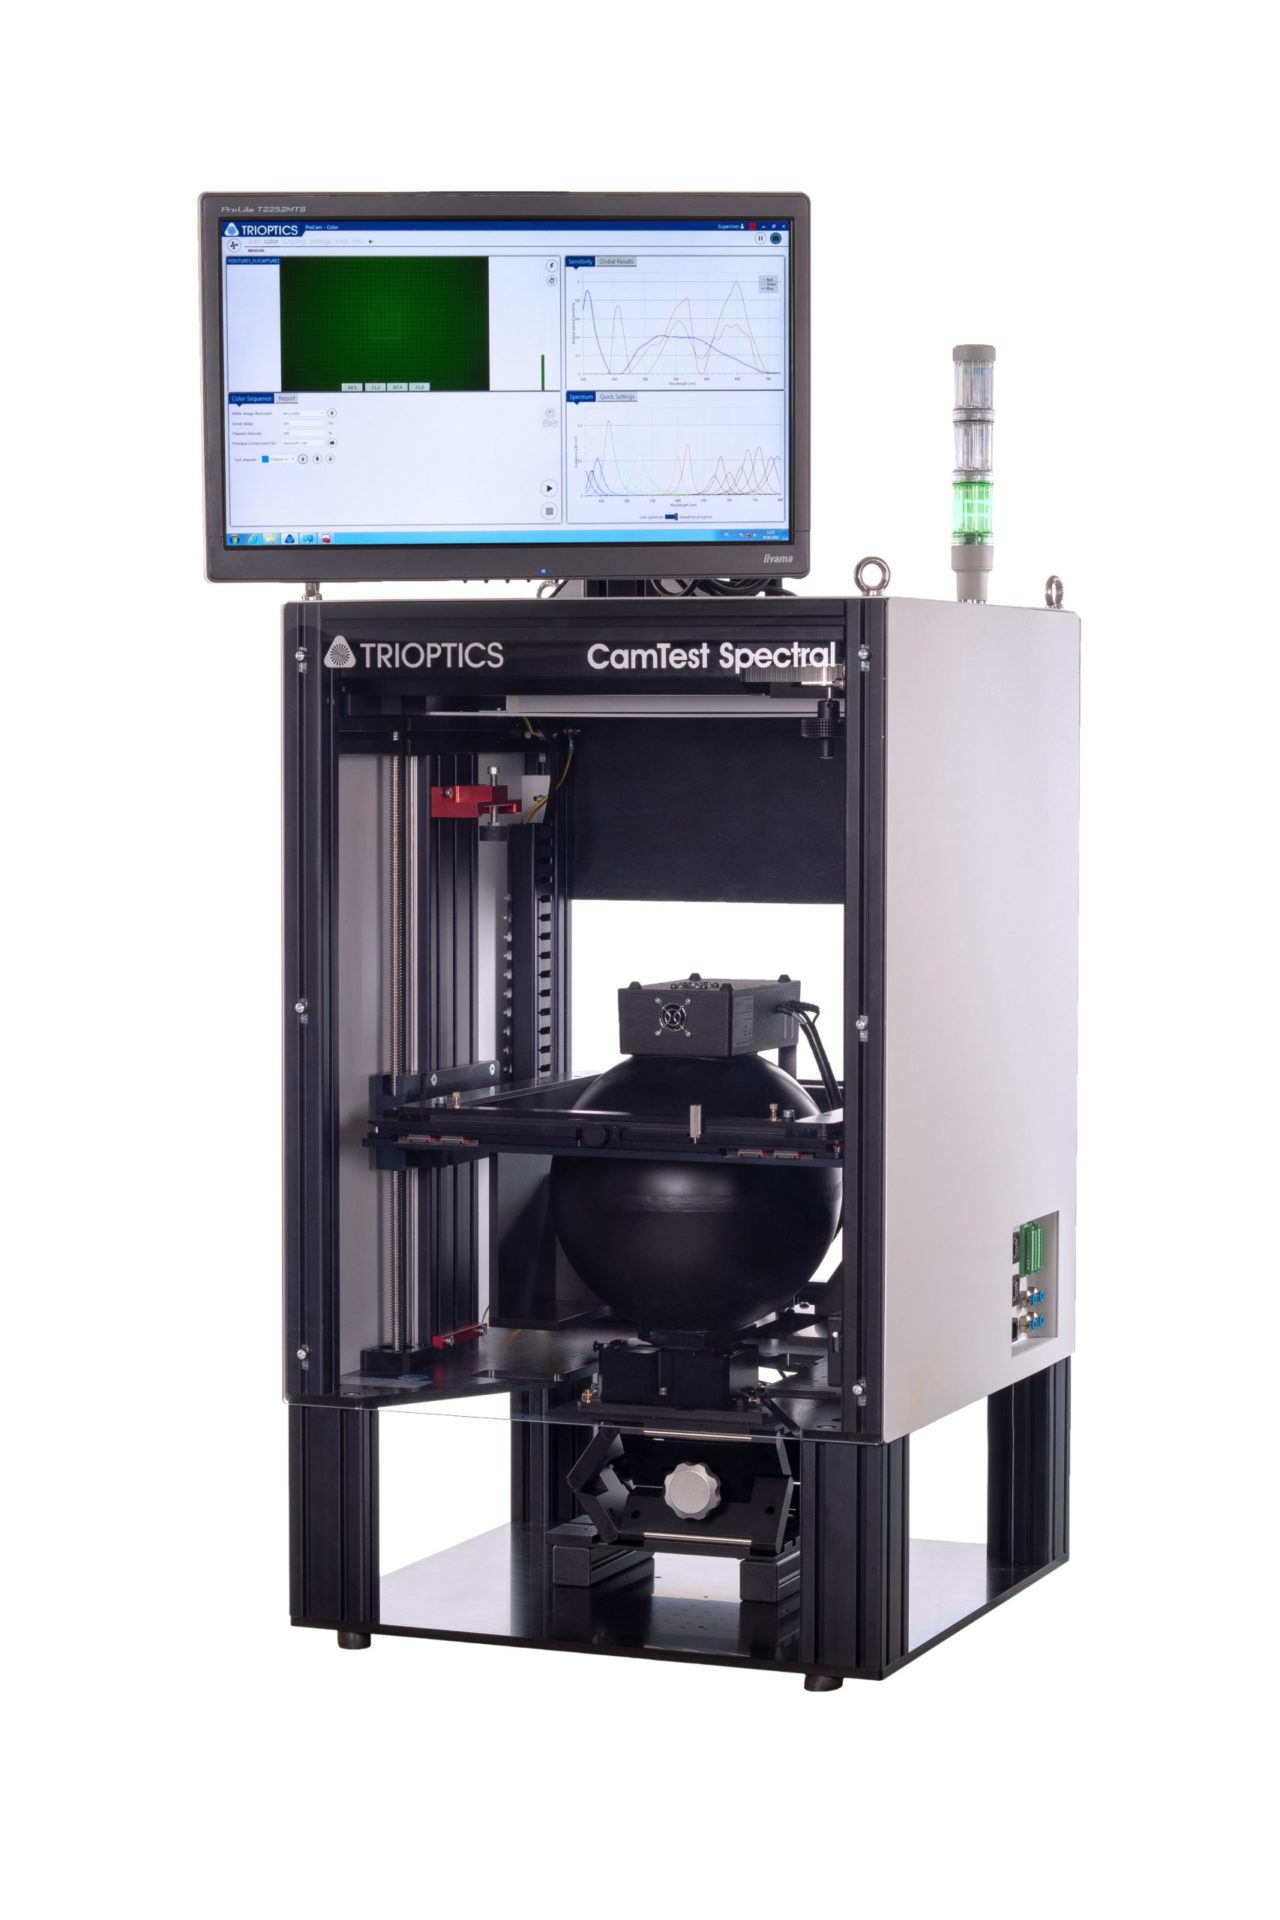
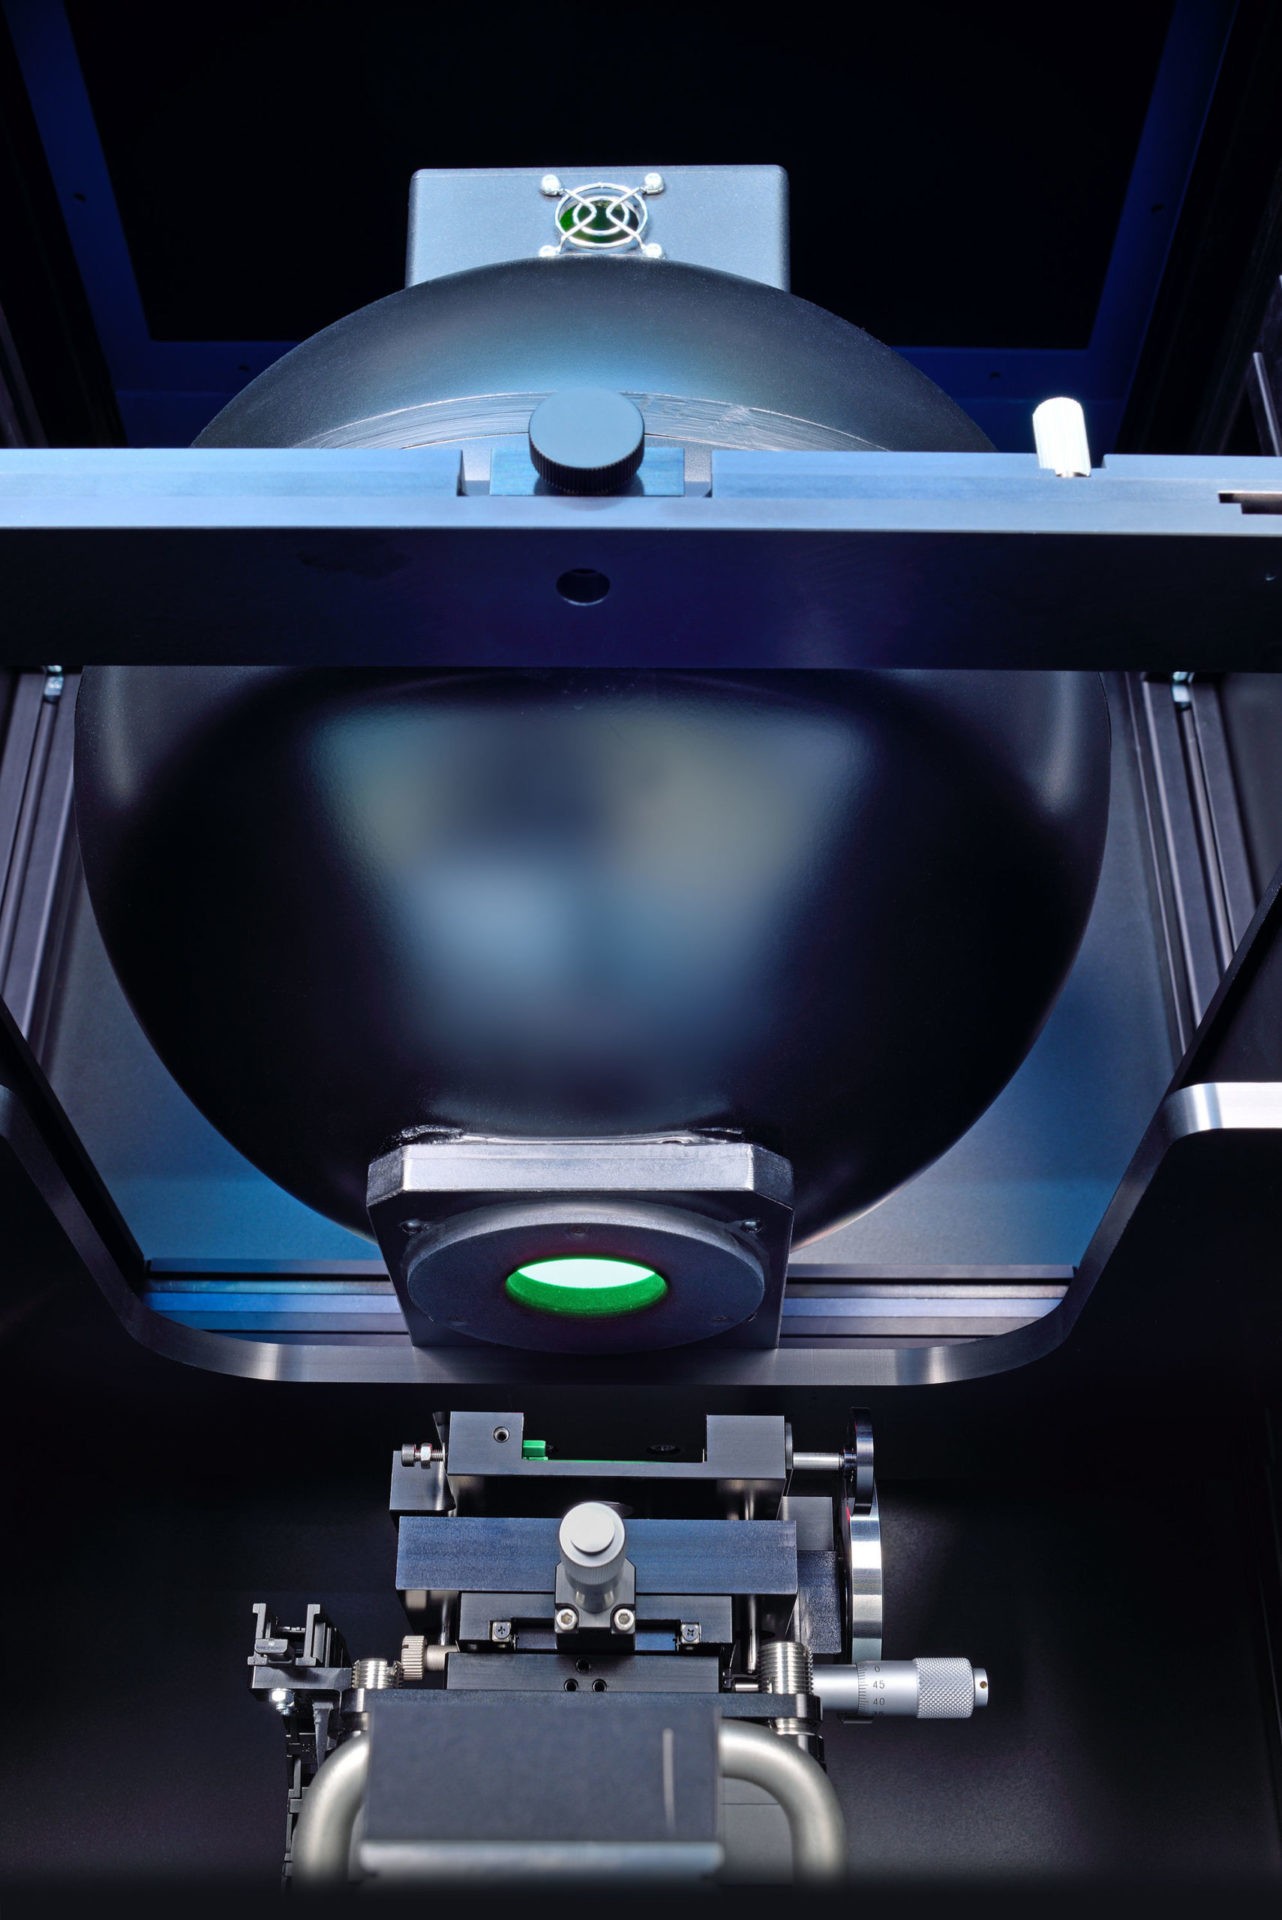
The CamTest Spectral test system made by TRIOPTICS in particular covers opto-electric measurement parameters. This test system was developed in cooperation with ImageEngineering and is based on a spectrally adjustable LED light source consisting of 80 LEDs that is homogenized to a concave outlet opening by means of an integrating sphere detector. It has an integrated spectrometer for real time measuring the spectrum and luminance. The camera modules to be tested can be lifted into the concave opening and illuminated homogeneously up to an image angle of 160° with various calibrated spectra and brightnesses.
The object generator is integrated in a measurement chamber that permits camera modules on work piece holders to be contacted and referenced automatically for mass production in production lines. With its standard dimensions of 600×600 mm2 the measurement chamber is designed very compact.


The following measurement parameters are currently implemented in the CamTest Spectral system. Extensions and additions are made continuously:
- Measurement of the opto-electronic conversion function (OECF)
- Measurement of the signal-to-noise behavior (SNR)
- Measurement of shading (relative illumination and color shading)
- Detection of defective pixels and particles on the sensor
- Measurement of spectral sensitivity and color reproduction
OECF and SNR
The measurement of the opto-electronic conversion function (OECF) determines the relation between luminous intensity and the digital intensity values issued by the camera. In the case of color cameras, this is carried out separately for all color channels (typically RGB). OECF measurement is based on the ISO14524 standard and on EMVA1288.
Typically, the luminance (cd/m2) or luminous density (lux) of the light source is gradually decreased from a saturated image to SNR = 1 with a defined spectrum (e.g. D65). The measurement of the input signal (luminance) in a central image area compared to the output signal (camera digital value intensity per channel) results in the OECF (also see Figure 3).
The OECF is used to measure (non-)linearity according to EMVA1288, which is also required to determine the camera’s MTF correctly. In addition, the OECF measurement serves to determine the signal-to-noise ratio from the mean value and the variance of digital brightness values per ISO 15739.
With linear OECF curves, an optimal white balance factor is measured for color cameras from the various gradients of the RGB OECF curves.

Shading
Another important parameter is the measurement of the decrease in luminous intensity towards the edge of the image. This is referred to as shading and is subdivided into luminance shading (relative illumination) and color shading. Luminance shading is caused by the relative decrease in illumination in relation to the objective lens’ image angle and by the angle-dependant sensitivity of the sensor pixels.
Color shading creates a color change in relation to the image height, often caused by IR-Cut filters in the cameras which many lead to angle-based spectral transmissions.
To determine the shading based on ISO17957, the image is divided into small sections in which the medium intensity is determined separately for each color channel. Assuming a radial, rotationally symmetric characterization of the shading, the center and the averaged radial homogeneity curves are determined. Also see the screenshot of such a measurement in Figure 4.

Defective Pixel and Particles
Homogeneous illumination of the camera module assists in detecting image defects (hot pixels, dead pixels, blinking pixels) per EMVA1288. In addition, an analysis of visible particles in the camera module is made possible by using the CamTest Spectral system and the ProCam® evaluation software made by TRIOPTICS.
Spectral Sensitivity and Color Reproduction
The CamTest Spectral system also allows the measurement of the spectral sensitivity of color cameras. With the help of “variable” narrow-band light source spectra in a range of 420 to 760nm, the color response of the camera is measured for each spectrum, and this is used to calculate the curves for relative spectral sensitivity for each channel. Figure 5 shows such spectral sensitivity measured curves.
In addition, color reproduction measurements, comparable to measurements using color test charts, can be performed. These have the benefit of spectra measured in real time with greater accuracy and not affected by the illumination and aging effects of test charts.

All measurement parameters are included as modules in the TRIOPTICS ProCam® software. The ProCam® software can be adjusted flexibly for a wide range of processes and customer cameras by means of integrated python script language.
At the same time, it also meets the process software requirements for automated production lines with regard to adjustable user rights, OPC-UA and TCP-IP communication interfaces, error categorizations and adjustable pass/fail limit values as well as MES connection, automatically generated measurement reports and measurement algorithms optimized to cycle times.
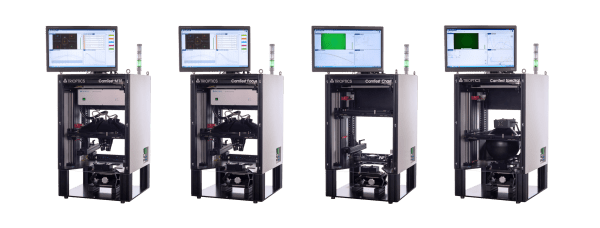
In combination with the “MTF,“ “Focus” and “Chart” CamTest systems, the CamTest Spectral system is able to test camera modules with regard to the most important image quality parameters. All this is reproducible under production conditions, 24/7, for even the smallest mechanical dimensions and fastest measurement times.


