
High dynamic range (HDR) imaging has become essential for modern ADAS and autonomous driving systems, but producing a visually appealing image does not always result in better perception performance.
Trade-offs between LED flicker mitigation, motion blur, dynamic resolution and low-light performance can significantly affect how reliably vehicles detect and interpret their surroundings. We spoke with Gabriel Bowers, Senior Principal Engineer at Mobileye, about why traditional image quality metrics are no longer enough, how real-world HDR validation should be approached, and why a “photon to KPI” methodology is becoming increasingly important for safety-critical automotive camera systems.


1.How significant is the trade-off between flicker mitigation and dynamic resolution?
Over the past decade, LED flicker mitigation has become an increasingly important topic in automotive HDR imaging. The feature allows the image sensor to use longer exposures that average out temporal light variations during capture, reducing visible flicker artifacts in the resulting image.
This trade-off is commonly managed with lateral overflow integration capacitor (LOFIC)-style pixel designs, which add charge-storage capacity so longer exposures can suppress LED flicker while preserving bright-region detail. In earlier automotive sensors, HDR was achieved by successively reading three or four exposures from the imager: the longest exposure provided better flicker mitigation but was more affected by motion blur, while the shorter exposures reduced motion blur but were increasingly susceptible to flicker. In newer LOFIC-style designs, the extended dynamic range of the long exposure reduces the flicker artifacts in an image – but at the expense of increasing motion blur.
This motion blur is important because it can reduce the effective resolution captured by the camera. Both components of blur should be considered – vibrational and blur related to vehicle motion. Specific to motion related blur – the amount of resolution loss due to motion depends on vehicle speed, object angular motion across the sensor, and image integration time. As driving speed increases, more scene details are lost unless the camera reduces exposure time to limit motion blur.
As an example – for a vehicle driving at 120 km/hour and using an exposure time of 11 ms that aligns to the minimum expected automotive flicker frequency of ≈90 Hz (1 / 11 ms) – the blur kernel size on the sensor for a street sign is approximately 3 µm at 50 m distance and grows to 7 µm at 30 m distance. This suggests an unexpected behavior where it is easier to read an object at farther distances. The counter-intuitive result occurs because the object’s angular velocity across the sensor increases as it gets closer to the vehicle, enlarging the blur kernel faster than the sign itself grows in the image.
Together, these effects show why better exposure or higher SNR does not necessarily translate into better perception performance. Longer exposure can suppress flicker and improve low-light appearance, but it can also enlarge the blur kernel size until it exceeds the pixel footprint. At that point, the camera may produce a brighter and cleaner image while losing the high-frequency detail needed for traffic-sign readability, pedestrian detection, or near-field object recognition — a behavior that is best quantified using Fourier-domain metrics such as NEQ, as discussed in Section 3. Flicker mitigation and low-light robustness can therefore compete directly with dynamic resolution unless exposure strategy is tuned for motion, scene geometry, and task requirements.
2. Which testing methodologies best capture real-world HDR performance?
HDR test methodology should be tailored to the intended vehicle use case. Each platform has a different driving profile, camera placement, field-of-view usage, speed range, and perception task, so no single generic test condition can fully represent real-world HDR performance. The most useful methodologies are the ones that explicitly map back to the conditions surfaced from SOP fleet data and the SOTIF-relevant scenarios identified in the validation plan.
A primary requirement is that the imager must preserve scene contrast across the required dynamic range so that relevant details remain distinguishable for perception algorithms. Contrast can be degraded by non-linear response, noise, flare, tone mapping, or HDR merge artifacts, and these effects can cause scene details to be lost even when the image appears well exposed. IEEE Std 2020-2024, developed through the IEEE P2020 working group, provides standardized guidance and metrics for evaluating these effects through seven key performance indicators: flare, noise, dynamic range, spatial frequency response (SFR), flicker, contrast performance indicator, and geometric calibration validation.
These lab measurements should be designed to represent the HDR scenes that matter most in the field — tunnel entry and exit, low-sun glare, oncoming headlights at night, LED traffic signals, and backlit signage. This helps ensure that controlled measurements remain connected to the real scenes where HDR performance is most likely to affect perception.
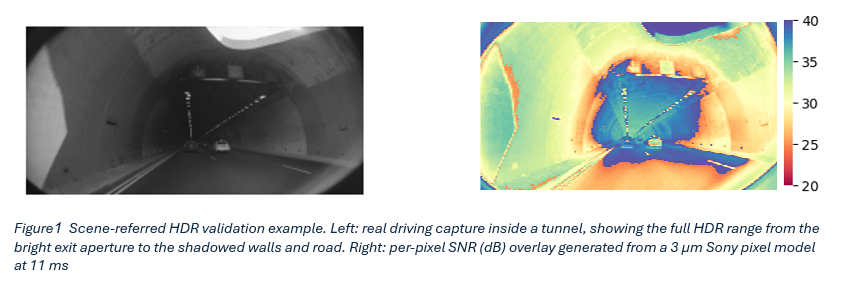
Real driving data can be used as a feedback loop to make HDR validation more scene-referred. For example, recorded pixel values can be converted into estimated per-pixel light input and passed through sensor simulation models to show where issues such as SNR loss are likely to occur in actual driving scenes. Figure 1 illustrates this approach using a tunnel scene, where the per-pixel SNR overlay highlights the road and tunnel-wall regions most at risk of contrast or detail loss.
3. What camera behaviours are often overlooked during validation?
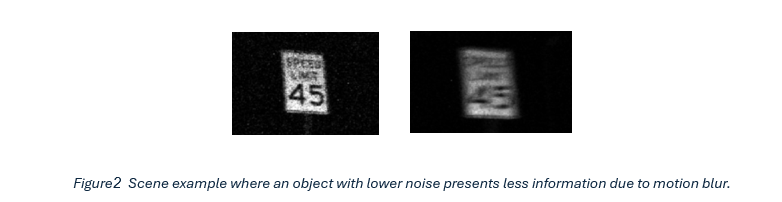
The trade-off between motion blur and low-light performance is one of the most commonly overlooked behaviors in camera validation. Lower noise does not always translate into more usable information: a longer exposure can produce a cleaner-looking image while simultaneously enlarging the motion-blur point spread function until fine scene detail is lost. The right-hand example in Figure 2 illustrates this directly — the object has lower pixel noise but carries less recoverable information because its high-frequency content has collapsed.
Greater adoption of Fourier-domain metrics such as Noise Equivalent Quanta (NEQ) which combines the spatial frequency response (SFR) and noise power spectrum (NPS) into a single curve of effective signal versus spatial frequency — can help close this gap. NEQ can be interpreted as ‘SNR per spatial frequency,’ and measured at different points of the imaging pipeline it makes visible how features such as denoise, sharpening, or HDR merge affect the information content of the scene rather than just its appearance.
A second reason these behaviors are overlooked is that traditional image-quality metrics were developed primarily to assess how well a camera reproduces a scene for human viewing. Standard targets such as the Macbeth Color Checker represent colors found in natural scenes but cannot represent the colors that matter most in an automotive scene — lane markings, traffic-signal reds and greens, brake lights, retro-reflective signs. Measurements built around human-viewing assumptions therefore systematically under-represent the conditions that drive perception performance.
Closing these gaps requires image-quality standards built specifically around automotive imaging rather than adapted from consumer or broadcast practice. In this context, IEEE P2020 is as it frames these measurements in the context of the automotive driving use-case. For engineers working on safety-critical camera systems, the P2020 working group also provides a practical forum for refining how these behaviors are measured, interpreted, and translated into validation practice.
4. How should engineers evaluate HDR performance for safety-critical applications?
To address the concerns of SOTIF (ISO 21448), the evaluation of HDR performance for safety-critical applications should be structured as an end-to-end process, tracing image usage from ‘photon to KPI’ to ensure no performance insufficiencies are overlooked. Understanding how each step in the process will use the image data and how its performance could be limited should help to define the validation tests needed. Further, knowledge gained at Mobileye from the history of SOP programs, numerous data collection campaigns, and a wide range of customers can provide insight that is difficult to define only in a lab environment.
As a first step, building a model of each component and sub-component of the optical path is a necessary step to estimate HDR performance and confirm that it fits within the expected range defined with SOTIF. A detailed analysis measuring these sub-components (for example – the dynamic range and noise of each exposure read from a pixel) can identify where issues can occur post-HDR creation in the imager.
Following this – the goals of any measurement should be to confirm that the device matches simulation. In the case of unexpected results – even better than expected results – can identify a misunderstanding of how the component works, which is exactly the kind of insufficiency SOTIF is meant to surface. Further, repeating measurements at more than one location and with different teams often can improve the reliability of such evaluations.
Road testing should not be treated as the primary validation method for camera performance. Instead, it is most useful as a feedback loop for discovering unexpected behaviors, identifying real-world use cases, and checking whether the lab validation plan has gaps. Because road data provides only an incomplete and random sampling of the camera’s full operating range, critical performance claims should still be confirmed through controlled and repeatable test conditions. Defining a comprehensive and repeatable test can provide a method to more thoroughly retest performance in the face of changes.
Don’t miss Gabriel’s presentation ‘Motion-Aware Characterization of Automotive HDR Cameras: Quantifying the Trade-off Between Flicker Mitigation and Dynamic Resolution‘ at AutoSens Europe this year!
Interested in In-Cabin monitoring technology?
With a pass to AutoSens Europe, you’ll also get full access to our co-located sister event, InCabin. Take a look at the full agenda for InCabin here >>